Deliveries week ending Jan 29th
with No Comments

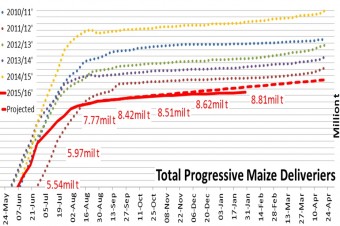
South Africa maize deliveries for the week ending Jan 29th came in at 34,510t with white maize making up 18,255t whilst yellow made up 16,255t.  Below … Read More

Ha planted vs Avg Yield
with No Comments

Adding on to yesterday’s graph, which showed the hectares of maize planted for South Africa for the current year and the past 22 years as shown … Read More

Intentions to plant 2016
with No Comments

Below is a line graph portraying the maize hectares planted in South Africa over the past 22yrs and vs the current estimate planted for 2016.

Ha planted from previous year
with No Comments

Wednesday’s CEC report surprised most traders, especially on the number of maize hectares planted. Below is a column chart portraying the % change for the maize … Read More

20-Day underlying volatility
with No Comments

Below is a line graph portraying the 20-Day underlying volatility based on MTM prices, the 20-Day underlying volatility based on the daily high and lows, an … Read More

US soy sowings to set record
with No Comments

US soy sowings to set record by even bigger margin than thought January 20, 2016 at 1:04 pm US soybean sowings will set a record this … Read More

South African Progressive Imports
with No Comments

South African maize exports for the week ending January 15th came in at 17,250t and vs the 10 week average of 14,253t.  White maize exports made … Read More

Mar16YM/Corn spread
with No Comments

Below is a line graph portraying the current year spread for March yellow maize over March Corn, cash settled and traded on the JSE, as shown … Read More

MarYM/JulYM Spread
with No Comments

Below is a line chart portraying the spread between July yellow over March yellow maize for the current year and vs. the previous 3years. The spread … Read More

1 14 15 16 17 18 19 20