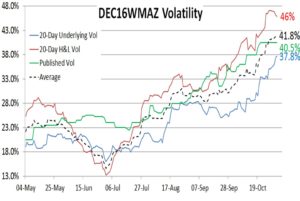
 Below is a line graph portraying volatility measures for the DEC16WMAZ contract. Volatility across the board, when looking at the chart, increased as factors ranging from changing weather conditions to geopolitical and local governmental aspects causing uncertainty on currency movement, affects local grain prices. The red line portrays the 20-day underlying volatility based on high&low’s whilst the blue line portrays the 20-day underlying volatility based on the futures end of day MTM. The black dotted line portrays the average of the two whilst the green line portrays the published volatility as set by the JSE at the end of each day
Volatility December White Maize
on 12 November , 2016
with No Comments


