


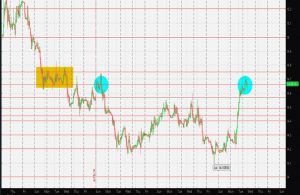
 Below is a 1hour chart portraying the price action for the USD/ZAR currency pair. A quick analysis shows the Rand gaining good strength but found support and traded sideways in the second week of April as shown by the mustard coloured rectangle. From there it slipped lower, retested previous support now resistance at R14.66/$ as highlighted by the blue ellipse and gained further strength only to find support around R14.20/$ which it was unable to break on several occasions over a two week period. More recently the Rand rallied strongly higher to new 3 week lows against the Dollar during the course of yesterday but again found resistance as highlighted by the second blue ellipse as shown in the graph below. Could we see a double top and a further strength in the Rand and probably R14/$ or will the weakness continue once more?…
South African Rand
on 5 May , 2016
with No Comments