


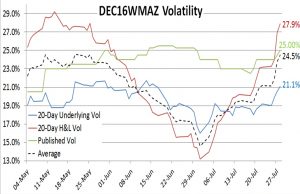
 Volatility slowed significantly for the DEC16WMAZ contract over the month of June and in the first week of July but has recently picked up well due to significant price swings as the market remains uncertain as to whether to continue to fall in its weakness or whether a significant correction to the upside is due. Below is a line chart portraying the 20-Day underling volatility shown in blue, 20-Day underlying volatility based on high and low prices shown in red, an average of these two measures just mentioned, shown by the black dashed line, as well as the published volatility in green
DEC16WMAZ Volatility
on 23 August , 2016
with No Comments