


Below is a long term historic chart portraying the trade action for the DEC16WMAZ contract over the past year and a half. The contract has shed more than 34% since making all-time highs back in January this year. Major long term support is seen at R3400 with further support at R3300 and R3000 whilst major resistance is seen at R3600 and R3800. Weather remains warm and clear with little chance of rains over the next week. It’s still a long way off to be certain, yet the long term forecast suggest good rains over our main maize growing regions for the week running Oct 13th – 21st. We’ll just have to wait and see if these rains are realized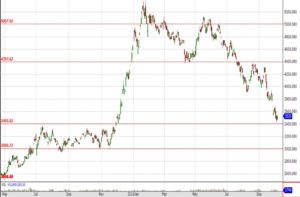
Dec16WM Graph 6 Oct
on 12 November , 2016
with No Comments