


Below is a daily candle stick chart portraying the trade action for the DEC16WMAZ contract over the past couple of 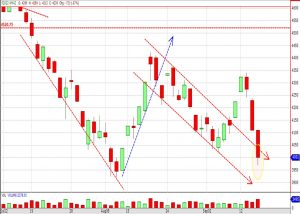 months. Maize prices plummeted and turned just R10 shy of another extended limits during the course of yesterday’s session. Trade slipped below the upper trend support and back into the downward trading range established in August as shown by the yellow dotted ellipse, to the right, in the graph below. Lower prices could be expected in the next week with the Rand looking slightly stronger. A move to R14/$ may be possible if R14.20 level is breached clear of. U.S. Z-contract (DEC) corn price has also failed to break above resistance at $3.33 and may be bound for sideways or lower trade
Breaking back inside the downward channel-Technical Dec16WM
on 16 September , 2016
with No Comments