


Below is a line graph portraying the 20-Day underlying volatility based on MTM prices, the 20-Day underlying volatility based on the daily high and lows, an average of the two ‘vol’ measures shown by the green line as well as the underlying futures price movement shown by the black dashed line for the MAR16WMAZ contract. 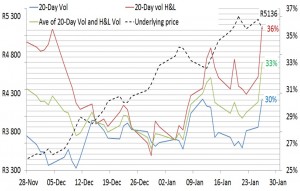 Volatility has climbed over the past 20 sessions as we’ve seen prices rise and fall in sharp moves. The three volatility measures have shown an increase of 3%, 9.6% and 6.4% over this period.
20-Day underlying volatility
on 28 January , 2016
with No Comments